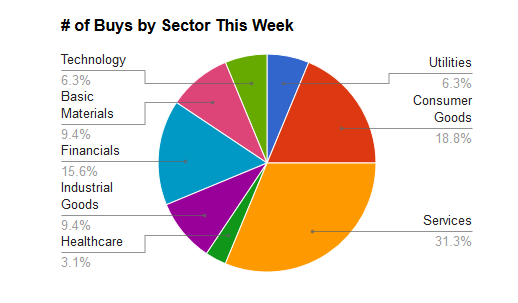
This weeks totals:
| This Week | Change From Last Week | ||||||||
| Total Stock Purchases | 38 | 17 | |||||||
| Unique Tickers Purchased | 31 | 10 | |||||||
| Different Bloggers making Purchases | 19 | 9 | |||||||
| Total Cost Of Purchases | $22,913 | 5132 | |||||||
| Increase in Dividends | $1,026 | 429 | |||||||
| Yield on Purchases | 4.5% | 1.12% | |||||||
I have charted the weekly S&P % Return vs Amount of Money invested in the market for that week.

Top Purchased Stocks this week:
1. RY, UNP - 3 Buys Each
2. PG, EMR,ABT - 2 Buys Each

Here is the summary of stocks, amount invested, and which blogger posted the buy with a link to the post:
Sector Information:
For the Sector information, I use FinViz.com when possible as it is easy to find a consistent sector list. Here are the Sector codes I use in the chart (# is the number of each stock purchased in that sector):| Sum of yearly Dividends | 1,025.77 | ||
| ID | Sector | # | Amount |
| 4 | Financials | 11 | 8255 |
| 1 | Basic Materials | 6 | 4240 |
| 7 | Services | 6 | 3325 |
| 5 | Healthcare | 6 | 2336 |
| 6 | Industrial Goods | 2 | 1648 |
| 3 | Consumer Goods | 4 | 1541 |
| 8 | Technology | 2 | 1068 |
| 9 | Utilities | 1 | 500 |
| 2 | Conglomerates | 0 | 0 |
| TOTAL | 38 | 22,913 |


I cross reference my list with A Frugal Family's Journey's list as well, but I do not guarantee the accuracy. If you see any mistakes, please comment or send me an email.
Disclaimer: I am not a licensed investment professional. I am not liable for any losses suffered by any parties. Any information on this site is my opinion only and should not be used for investments of any kind.