This weeks totals:
- 39 Total Purchases(+11 from last week)
- 28 Uniquely Different Stocks Bought (+4 from last week)
- 21 Different Bloggers Posted Buys(+7 from last week)
Bloggers increased forward yearly dividends by $1,458! That's a 5.2% Average Yield on Investment!
I have started something new this week as recommended by a couple bloggers in the past. I have a weekly S&P % Return vs Amount of Money invested in the market for that week. It is starting to show a correlation which does make sense, if you think about it. The cheaper stocks are, the higher dividend yield, the more interested bloggers become.
Top Purchased Stocks this week:
- KMI - 5 Buys
- VTR - 3 Buys
- OHI,WMT - 2 Buys
Here is the F.A.S.T Graph for KMI.
Here is the summary of stocks, amount invested, and which blogger posted the buy with a link to the post:
Sector Information:
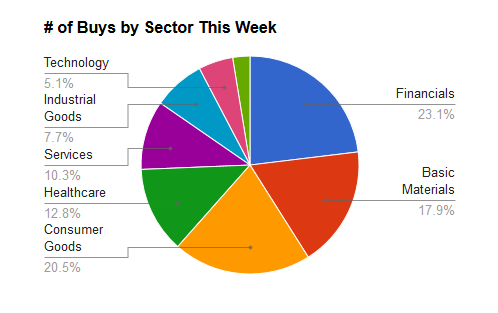
For the Sector information, I use FinViz.com when possible as it is easy to find a consistent sector list. Here are the Sector codes I use in the chart (# is the number of each stock purchased in that sector):| Sum of yearly Dividends | 1,455.82 | ||
| ID | Sector | # | Amount |
| 4 | Financials | 9 | 8686 |
| 1 | Basic Materials | 7 | 8250 |
| 3 | Consumer Goods | 8 | 4409 |
| 5 | Healthcare | 5 | 1863 |
| 7 | Services | 4 | 1785 |
| 6 | Industrial Goods | 3 | 1652 |
| 8 | Technology | 2 | 1296 |
| 9 | Utilities | 1 | 75 |
| 2 | Conglomerates | 0 | 0 |
| TOTAL | 39 | 28,017 |
I cross reference my list with A Frugal Family's Journey's list as well, but I do not guarantee the accuracy. If you see any mistakes, please comment or send me an email.
Disclaimer: I am not a licensed investment professional. I am not liable for any losses suffered by any parties. Any information on this site is my opinion only and should not be used for investments of any kind.


Adam,
ReplyDeleteVery interesting data on the S&P correlation.
Thanks for sharing!
D4s
Thanks D4s! It is interesting data isn't it. I look forward to see what the trend is as I get more data. Thanks for stopping in and sharing on Twitter!
DeleteI really like the buys to the S&P correlation chart... keeps all us bloggers accountable to buying when stocks are cheap(er). Looks like we did a pretty good job on that last dip. It's not quite a 1 to 1 correlation because some stocks could have a decent size drop while the market stays flat but otherwise, this will be fun to see.
ReplyDeleteThanks for the mention too!
ADD
You're right ADD... This doesn't tell the entire story. It would be interesting to see the performance of the stocks that bloggers bought vs total spent that week but that's much harder to collect. I will keep thinking about ways to improve this though. Thanks for the comment and stopping in to read!
Delete-Adam
KMI has been making the rounds quite a bit among the dividend bloggers. I guess with their continued dividend increases and relatively safe business model and moat it seems like a solid long term bet especially once oil prices rebound. I added CAT and DOV during the week. I guess those haven't been as popular.
ReplyDeleteHi DivHut, Thanks for the comment! I think the only question with KMI is WHEN oil prices are going to increase again (and maybe even IF they will). I know CAT has been popular in past weeks. DOV you see a bit too but not as often as other names. Take care!
Delete-Adam